|
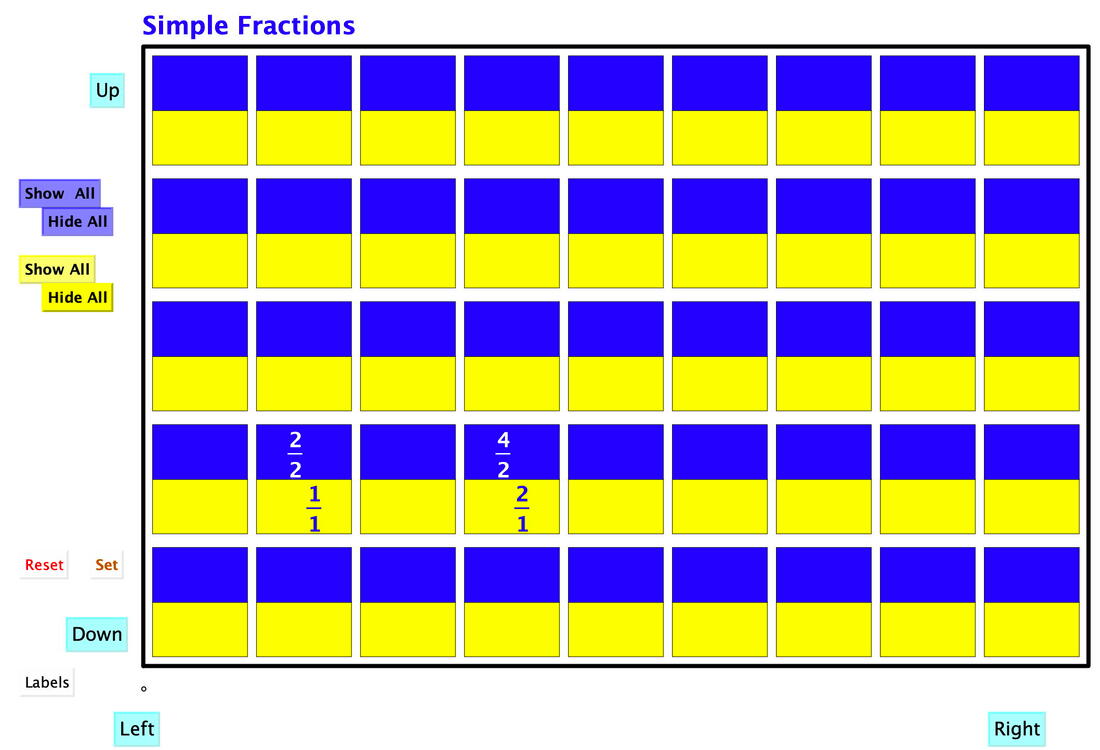
Odd & Even Grid Associativity grid Distributivity Grid |
WARNING
Safari seem unable to unzip folders, so you have to ensure that Safari is not trying to open files automatically
(see Safari/General)
(see Safari/General)
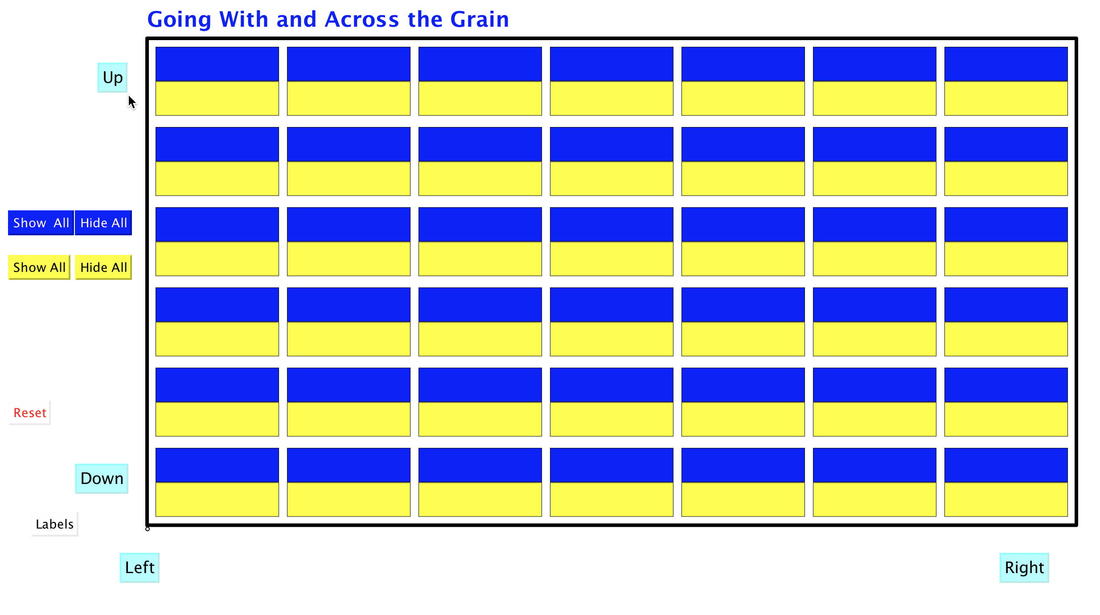
What is a(n) SVGrid?A Structured Variation Grid is a two dimensional grid of cells.
In most cased each cell has two parts, a proposed calculation (blue background), and a result (yellow background). Treating the two parts of a cell as a statement of equality, each cell is a particular case of some general formula or relationship. |
The visible grid can be thought of as a window onto an effectively infinite grid extending in all directions.
|
Pedagogical Purposes
The idea is to provoke learners into using their natural powers to detect patterns, to imagine and express predictions, to generalise, at first for particular cells but eventually for any-all cells in general.
By following patterns of natural numbers or sequences related to natural numbers, learners can be encouraged to ‘go with the grain’, to ‘follow the flow’ and so to anticipate and predict.
By connecting and relating the two parts of cells, learners can be encouraged to ‘go across the grain’, to experience structure, in order to make mathematical sense, both in particular (in particular cells) and in general.
Put another way, relationships between yellow and blue parts of cells can be seen and expressed as properties which hold between the cell parts of any cell in the grid. Learners can then use the structure of the yellow cell entries in order to justify their predictions for the blue cell entries. In this way they are experiencing mathematical structure (as displayed in the grid), learning to reason on the basis of stated properties, and making mathematical sense. They are also appreciating that mathematics does make sense.
After exposure to several grids, learners may begin to think about mathematical structure in terms of grids: the route between two cells does not matter, for the transformations involved in moving to adjacent cells are structurally related.
For elaboration of pedagogical theories underpinning the development and use of Structural Variation Grids see Pedagogical Constructs and With and Across The Grain. Use of the grids provides an opportunity to notice how the structure of learners' attention shifts from moment to moment, and how sometimes it gets stuck.
NOTE: I am currently converting the grids to Cinderella (free at Cinderella.de) but the .html files can be run from a java-enabled browser.
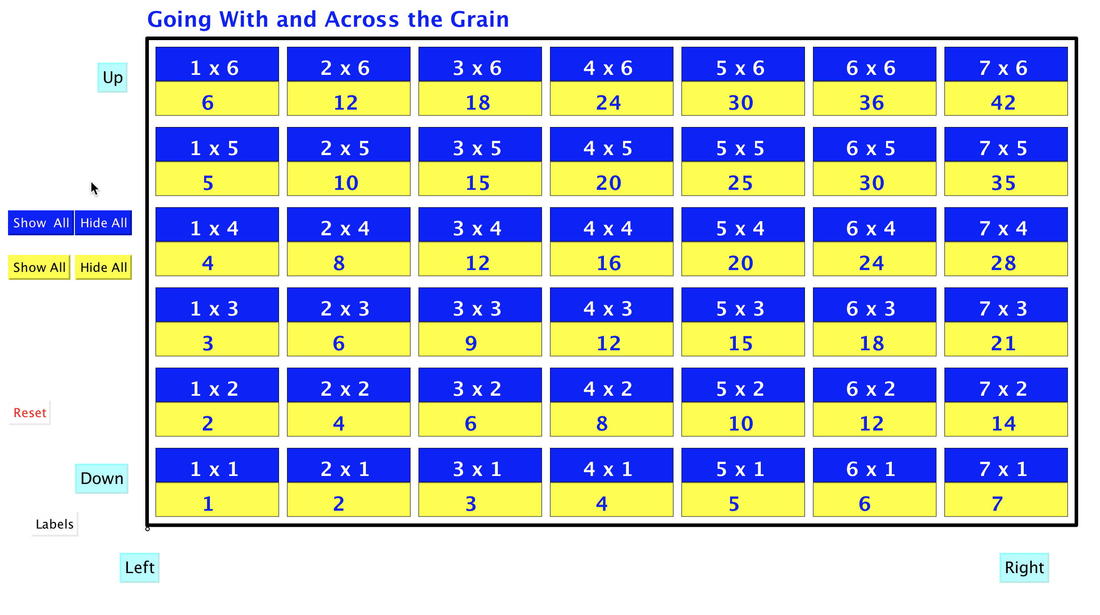
Example: Multiplication Grid
Grids are available to be downloaded: see below the image
|
I am unable to work out how to make the applet active on the site.
When you download, you get a zipped folder which includes notes on the principal features of the grid. This particular grid enables you to get learners to predict (-1)(-1) and more generally. Start with the grid empty. Move the window so that 0 x 0 is in the middle, and then follow rows from right to left in the yellows clicking and predicting before clicking again. Then work down the columns, and also follow columns (on the right) down, and then along rows from right to left, to see that the results are necessarily consistent and fit with the obvious patterns along rows and down columns. multn_grid.zip |
Available Grids:
Adobe are cancelling Flash as of the end of 2020.
Cinderella-based Grids (which can be run without Cinderella) are being added)
Tunja Grids
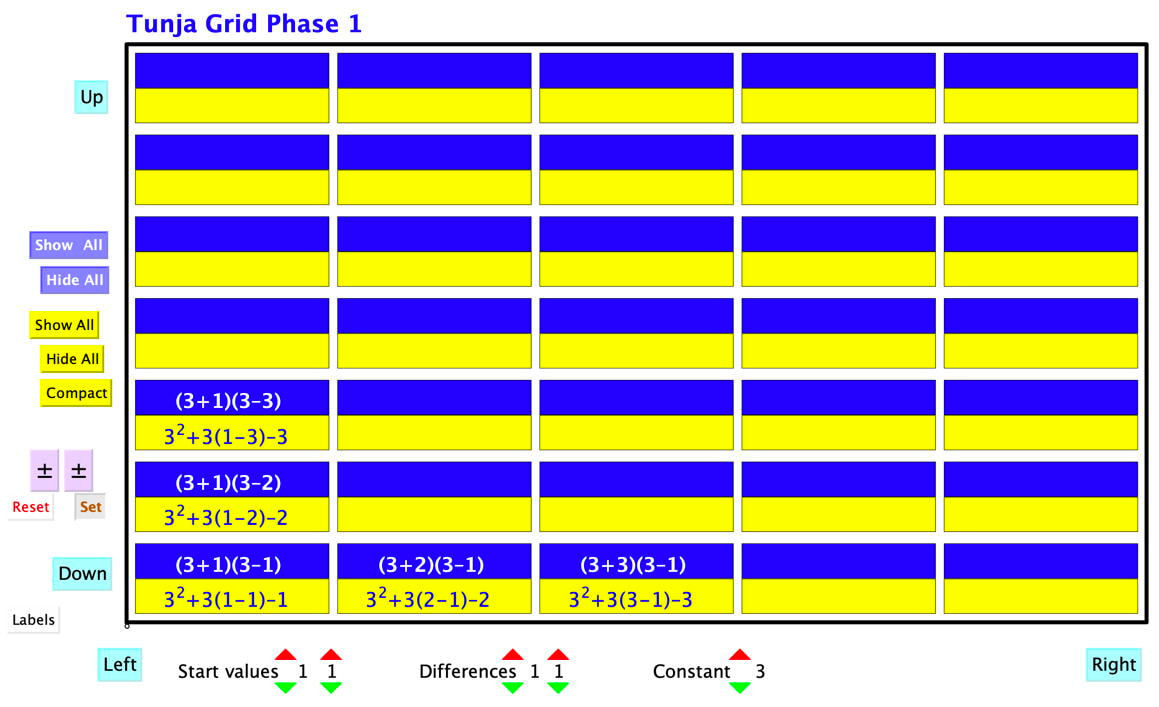
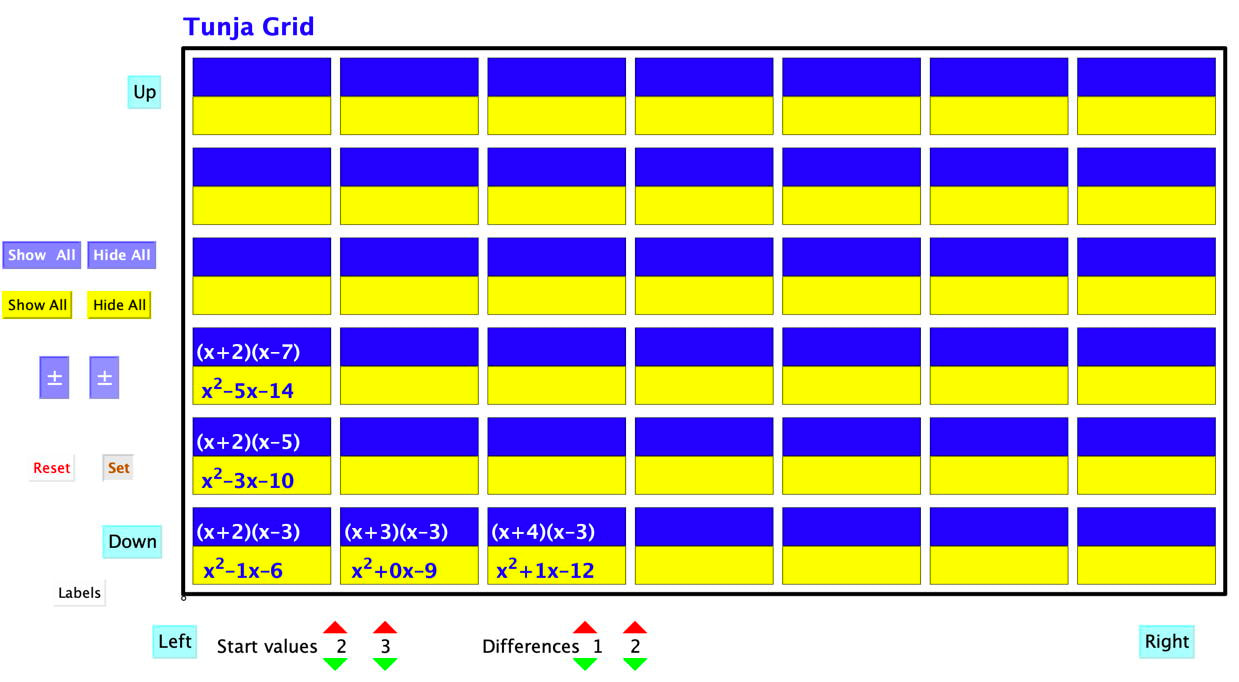
These were invented in response to a request to teach factoring of trinomials to learners not yet confident with (-1)(-1) = 1. See
Mason, J. (2001) Tunja Sequences as Examples of Employing Students' Powers to Generalize. Mathematics Teacher. 94(3) p164-169.
Tunja Grid Applets (Phase1 and Phase 2)
|
Revealing a few of the cells so as to invite generalisation across rows and up columns. Normally one would start with the blues; on another occasion, the yellows; on a further occasion the two together, predicting one from the other.
Also shown is the result of pressing the Set button so as to change the differences along rows and up columns. The ± buttons change the signs. These two applets come in SA (Stand Alone) versions as long as the .js files are retained. In Phase Two, the generalisations reached using phase 1 are then explicitly used to treat binomial expansion or factoring. |
Drakensberg Grid
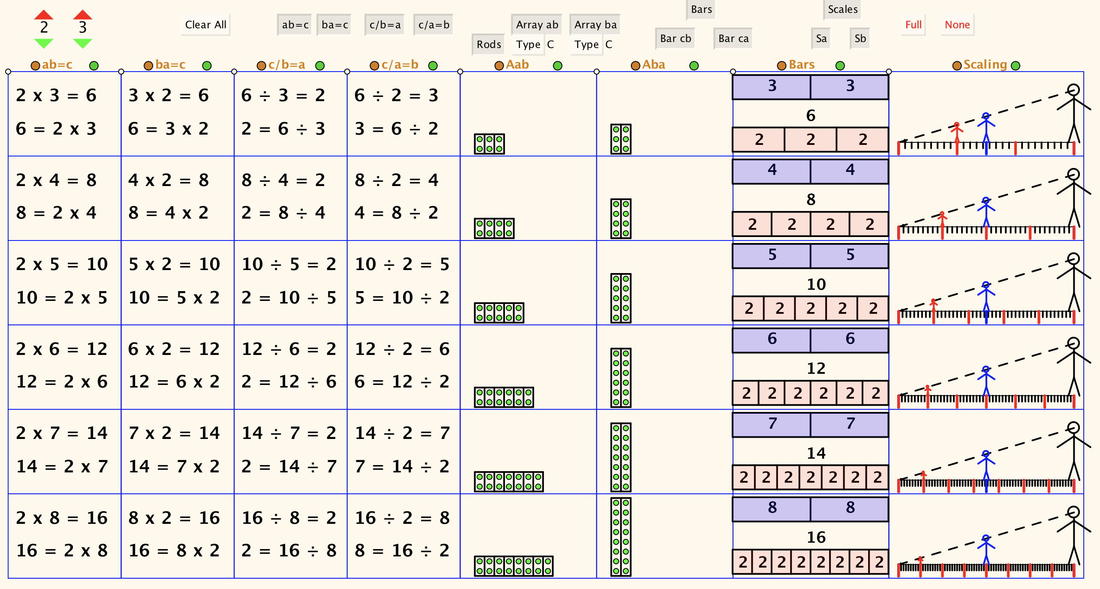
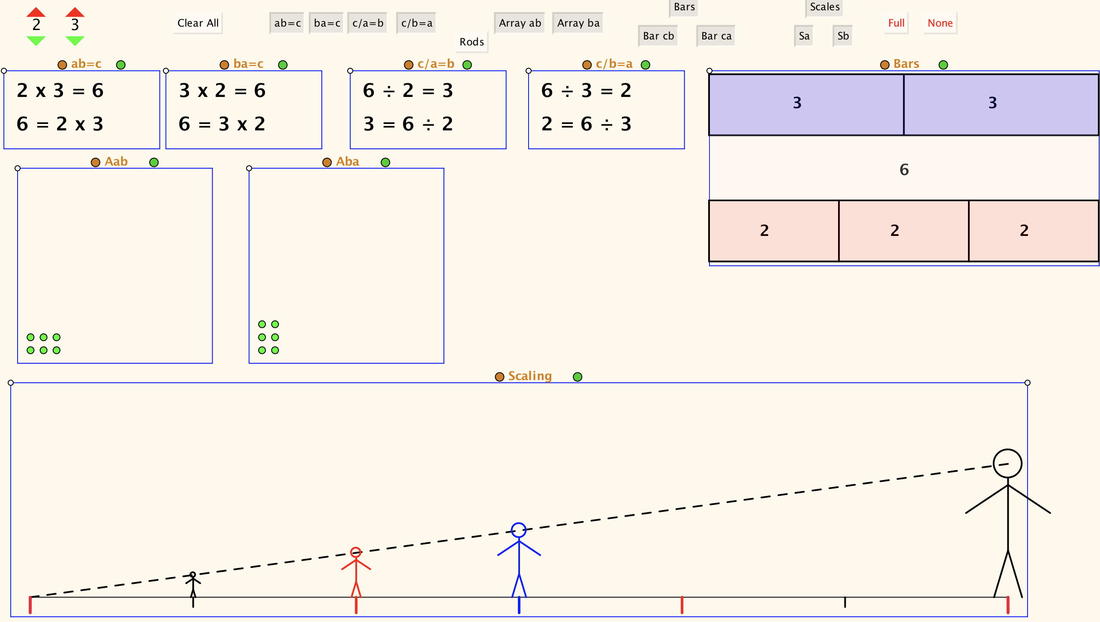
Developed while working with Hamsa Venkat, Mike Askew and Anne Watson in the Drakensberg, this grid is designed to work on the commutativity of multiplication, discrete and continuous, using symbols, arrays, bar diagrams and scaling.
The grid displayed has all the entries showing. The usual way of using SVGrids is to reveal cells gradually so that learners can begin to conjecture what they will see next.
In order to work on relationships between different presentations of commutativity, there is also a single-line applet. The numbers can still be varied, but not juxtaposed.
Applets are available here: Drakensberg Grids
Some DifferenceSums and differences of positive and negative whole numbers. Some Difference Applet
|
Odd & Even SumsSums of pairs of numbers classified as odd or even
(idea from Elaine Simmt) |
Altered Products
|
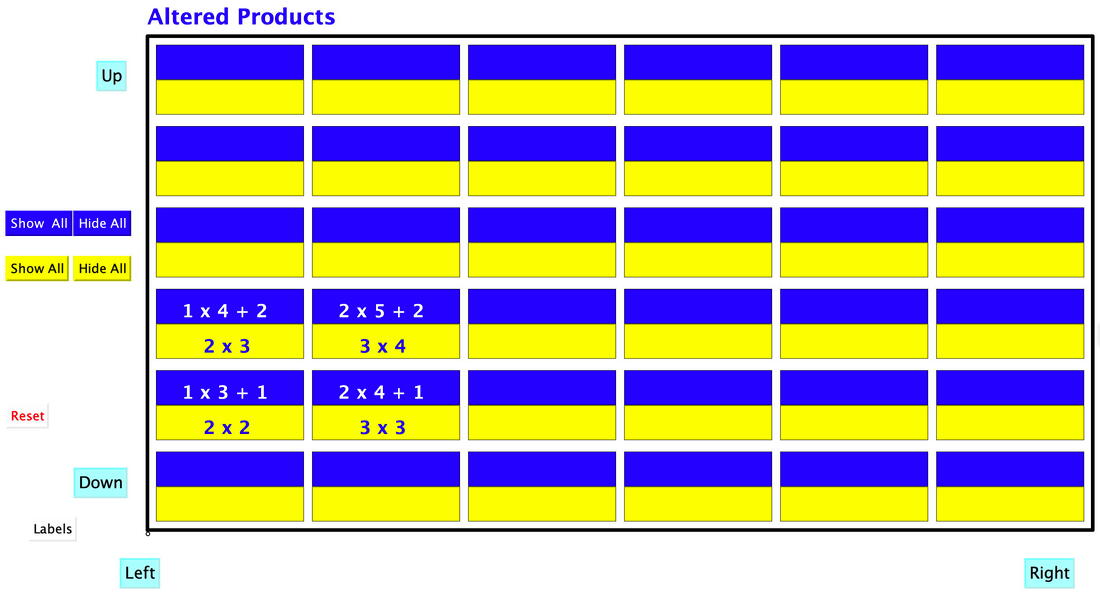
Adding something to a product can sometimes also be factored. This griod is a simple exercies in spotting, articulating, and expressing patterns, leading to algebra.
Altered Products Applet see also More-Than Products |
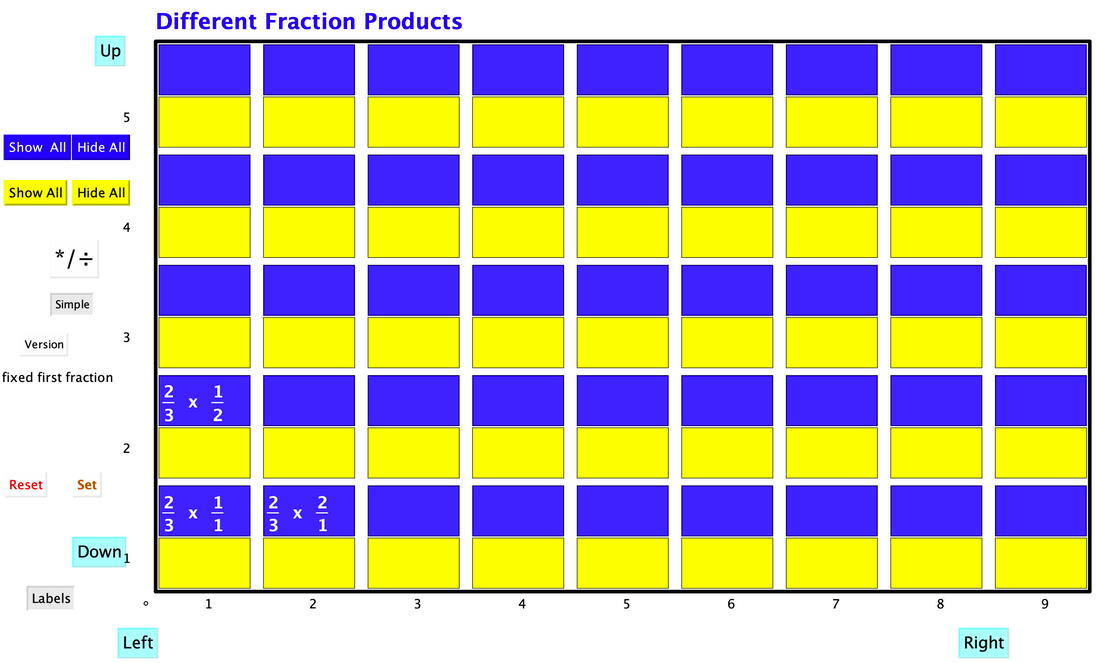
Distributivity
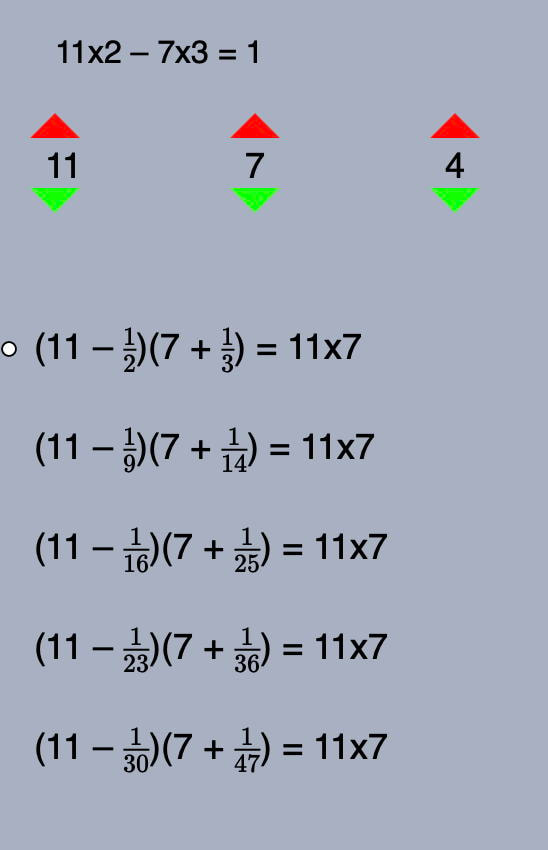
Use of brackets to group an addition or subtraction with a multiplier
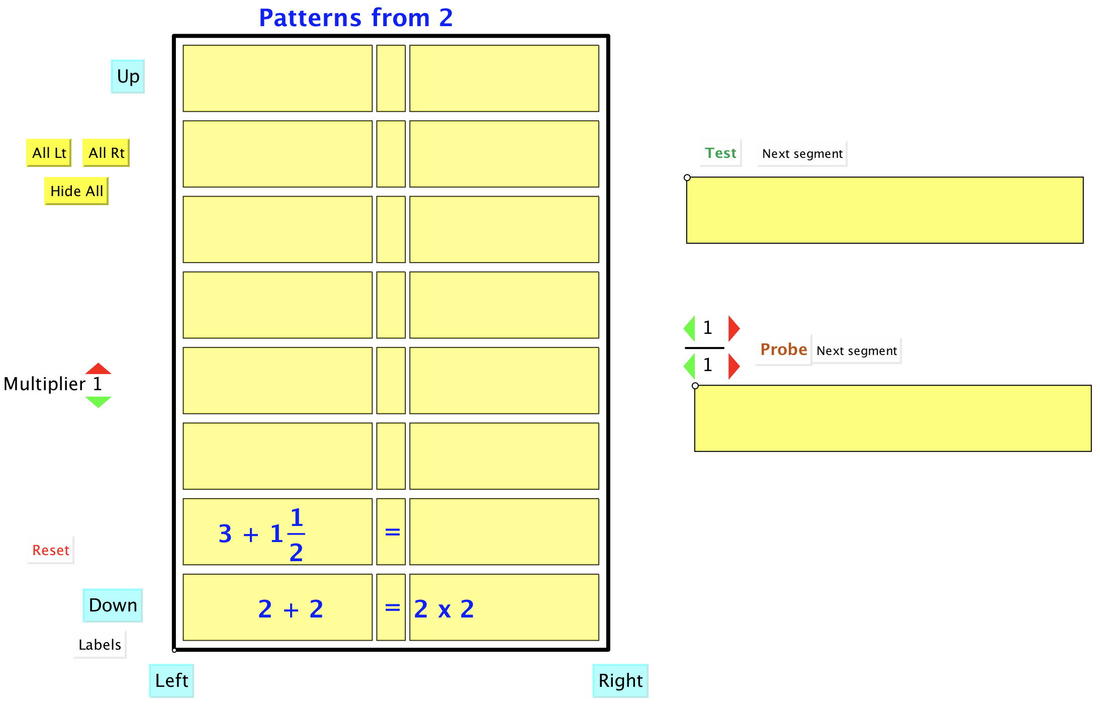
Patterns from 2
This applet provides an endless supply of relationships
between adding and subtracting fractions,
offering opportunity to detect relationships and express
them as generalities
Patterns from 2 applet
between adding and subtracting fractions,
offering opportunity to detect relationships and express
them as generalities
Patterns from 2 applet
|
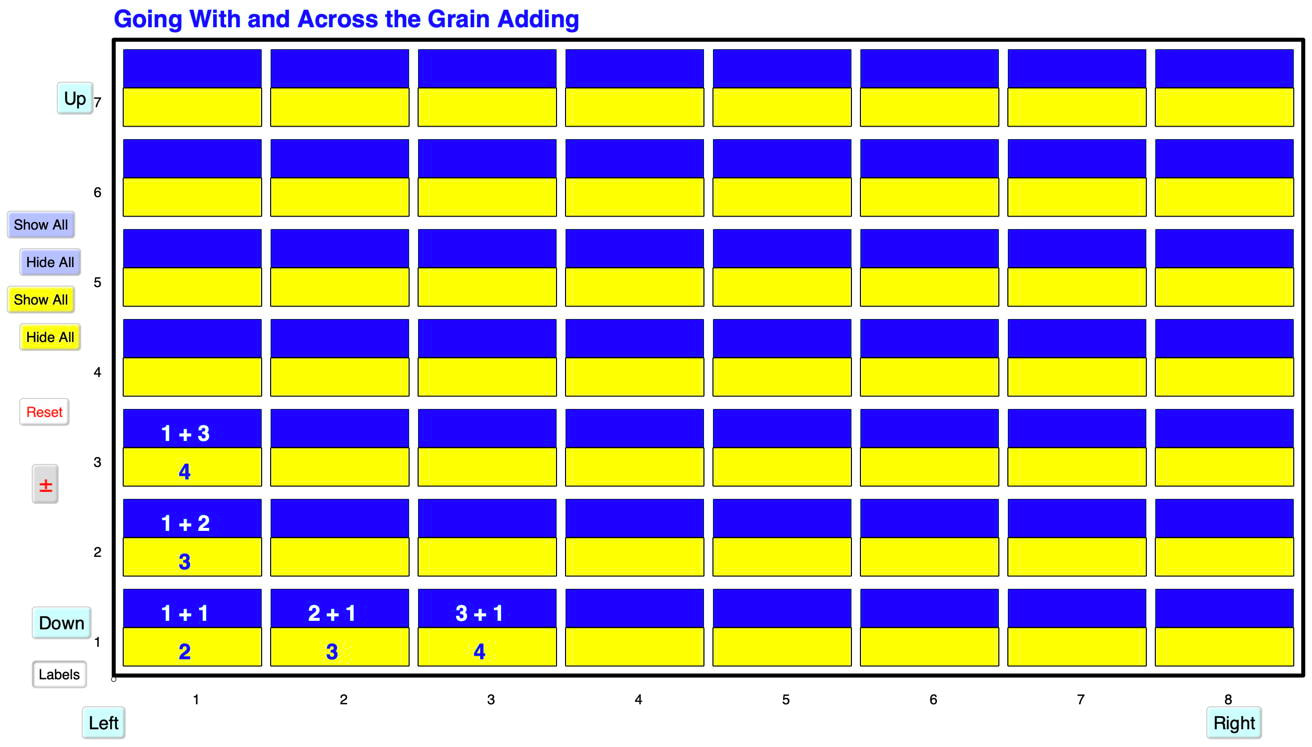
This is part of a single column on an otherwise infinite grid.
Here the first two left hand cells have been clicked and the first right hand cell. Clicking displays or hides the cell contents. As usual the window is controlled by the four cyan buttons. The user can test themselves on a random start number using the Test button, and probe by using the arrows to specify an input number. |
|
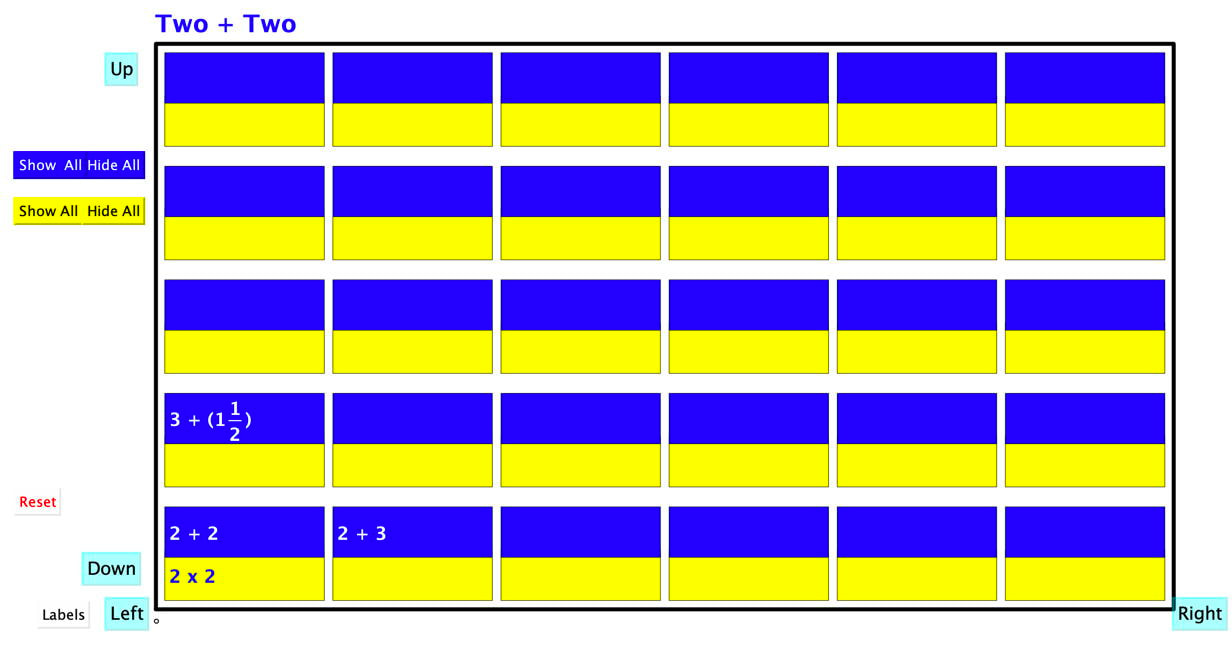
A different version of the same thing, affording opportunities to change the relationship.
Two + Two Grid Applet |
With and Across the Grain: More Than Products
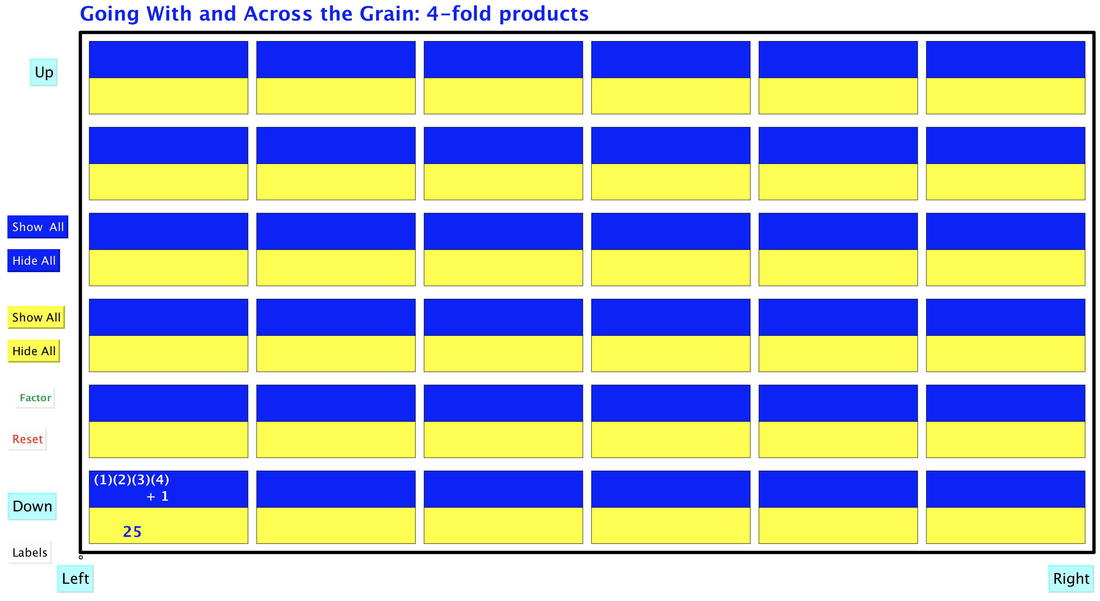
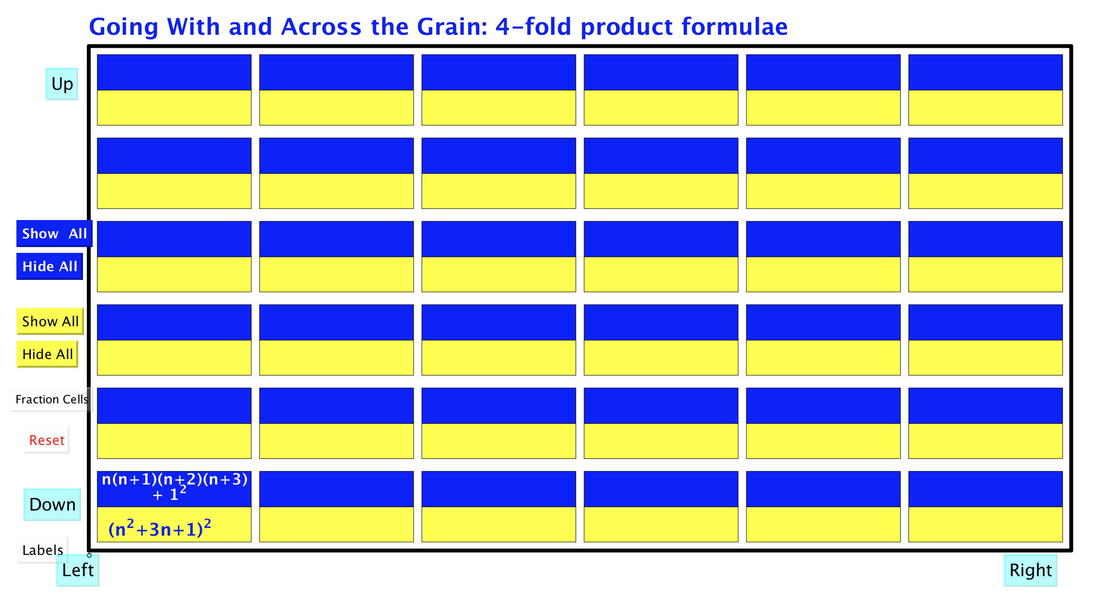
These applets support working on variations of the question: what numbers can arise as one more than the product of four consecutive numbers?
More Than Products Applet V1
More Than Products Applet V2
More Than Products Applet V1
More Than Products Applet V2
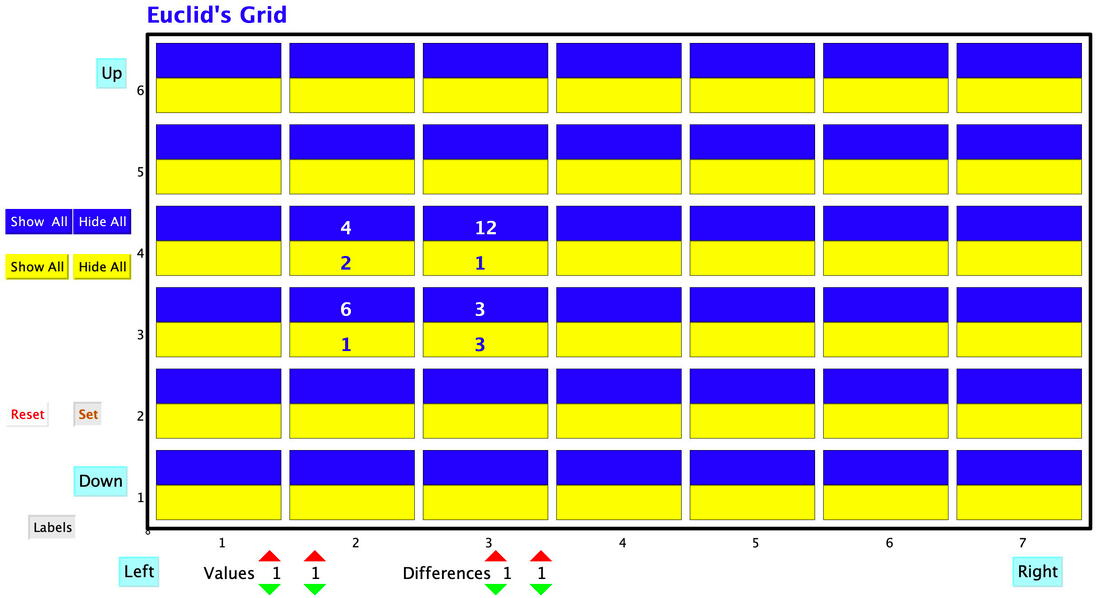
Euclid's Grid
Euclid, Bezout, and Bezout's Consequences
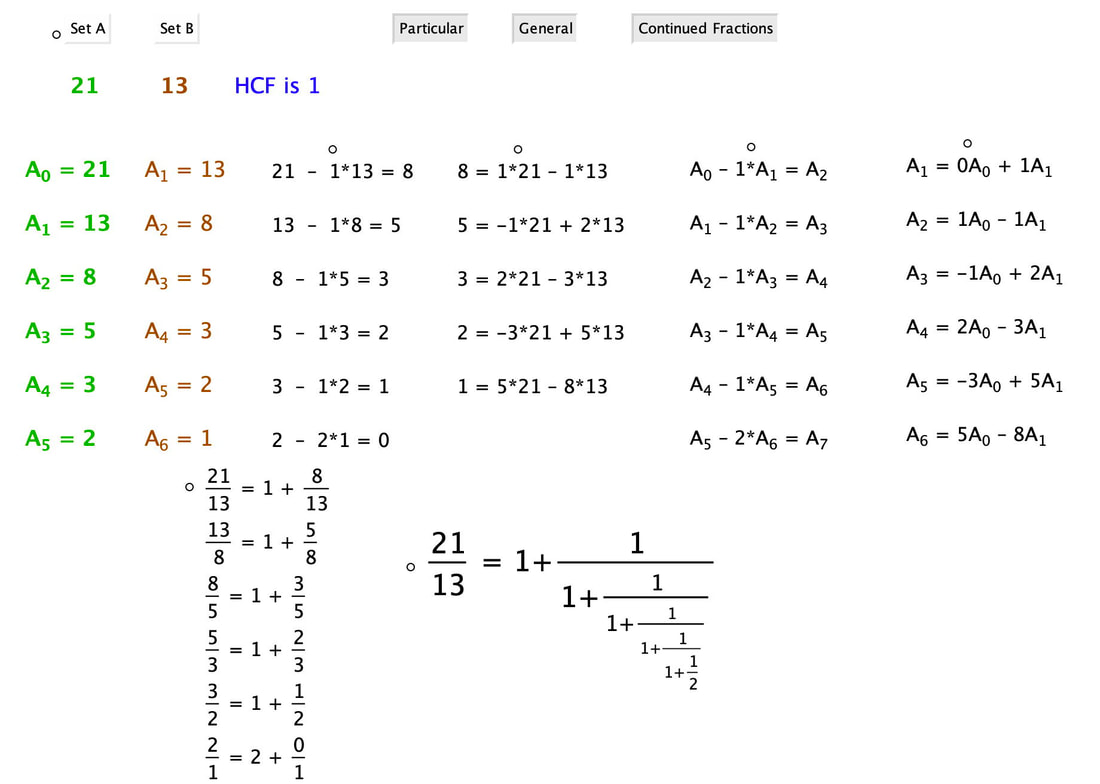
Euclid's alghorith finds the greatest common divisor (highest common factor) of two numbers, simply by using subtraction rather than having to do any factoring.
Bezout's relation is the set of solutions to the equation ax + by = (a, b) = gcd(a, b), which are found by careful book-keeping during Euclid's algorithm.
Bezout's consequences provide a sequence of relationships derived from bezout's relation, and a p[ossible motivation for it.
Euclid, Bezout & Consequences Applet
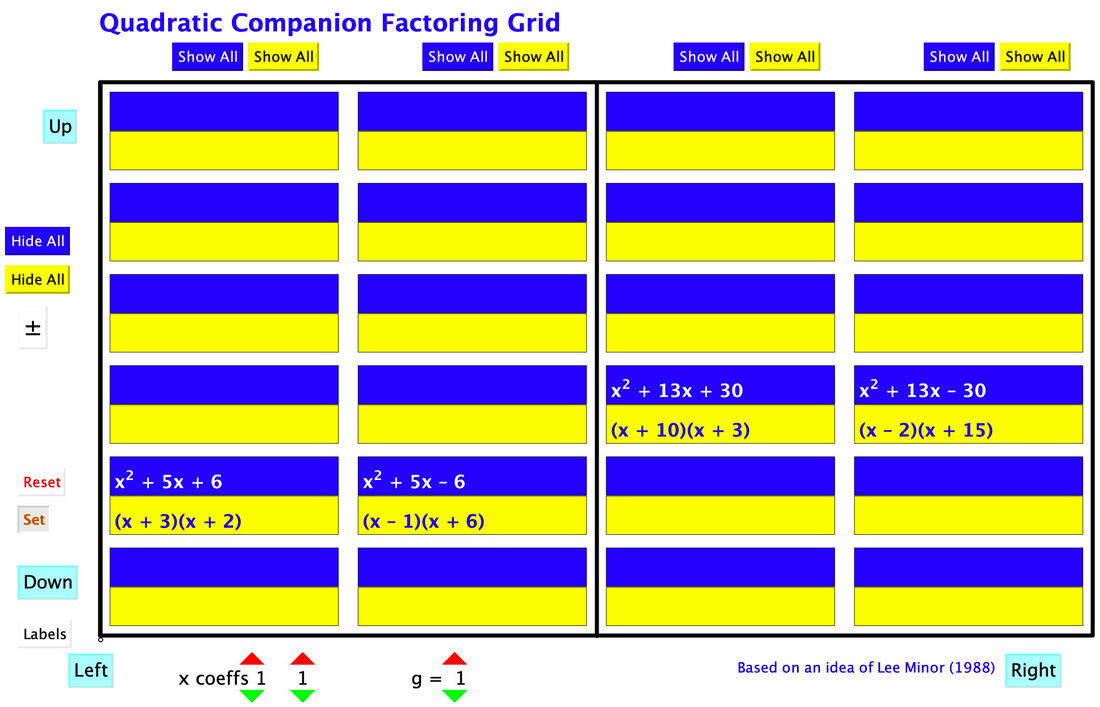
Quadratic Companion Factoring
|
Lee Minor (1988) asked when it was the case that two quadrtics with the same absolute value coefficients would both factor over the integers. This SVGrid supports investigating this question.
There are notes on ways to use the applet and how the buttons work. Quadratic Companion Factoring Applet |
Ways of Working With SVGrids
SVGrids are designed to be used with one or more learners under the direction of a teacher. The teacher is needed to expose certain parts of certain cells and then to prompt learners to conjecture and justify entries in other cells.
The basic idea is to expose a sequence of cells in a row or column, to predict and generalise (going with the grain), and to make structural sense by connecting the patterns between the entries in yellow cells, and patterns in the entries between corresponding blue cells.
Strategy One
Often it is sensible to start by exposing the blue cells in some line, in sequence, so that learners can use their natural powers of pattern spotting to anticipate and predict the next entry, and then to express a generality.
The direction arrows shift the window so that further cells in the sequence can be predicted and exposed.
Parallel lines of cells can be used to expose related sequences, and then the two dimensionality can be used to predict the contents of any such cell.
Hiding all the blue cells, you can then do the same pattern-detecting and cell prediction with sequences of yellow cells.
When both blue and yellow cells are readily predicted, attention can be drawn to whole cells (blue and yellow parts) and the relationship they express when treated as being equal.
Strategy Two
It is sometimes sensible to start with exposing a yellow cell, and then, after a pause, the corresponding blue cell. Then another adjacent to it, and then another adjacent to that, so that a line of cells is exposed.
Learners are invited to anticipate and then predict the contents of other cells, and eventually, of any cell in the grid. Attention is drawn both to relationships between cells, and relationships between blue and yellow parts of cells. Some of these relationships can be taken as properties, and then used to justify the equality of the blue and yellow parts.
Grid Buttons
Clicking on a cell reveals either a calculation (bottom) or a result or alternative format (top).
Clicking on a large arrow moves the window one position in that direction,
so that it is as if there is a small window looking onto an infinite grid.
Clicking on a solid yellow or blue button reveals the cells in the associated column,
or where there is only one button, all the lower (upper) cells.
Clicking on a 'sun behind cloud' reveals parameters that can be adjusted;
clicking again hides those parameters.

