
Reasoning about Graphs of Functions
NOTE: the applets require Cinderella which can be downloaded free from Cinderella.de
Some of them are in javascript and so do not need Cinderella itself
Some of them are in javascript and so do not need Cinderella itself
ZigZags
|
Max-Min Lines
|
Rational Polynomials
|
CobWebs
|
Iterated CobWebs
|
Flask Graphs
Striking a Chord
The first four applets explore constructions on chords of smooth functions, using botE Fixed Width & Fixed end chords, so treating the constructs globally and locally.
The first rehearses how Lagrange Polynomials are constructed, as these are the functions used in the other applets.
The second explores the concept images available from FW and FE chords in relation to rise of as chord, and th slope (gradient) of a chord.
The third launches into other constructs associated with a chord, so as to open up to exploration the rate at which the constructs go to zero in terms of powers of the width (the order). Thus first order is associated with the derivative, second order with the second derivative, and so on.
Building Lagrange
|
Exploiting the properties of 0 and 1 to build the Lagrange Polynomial through up to 8 pre-specified points.
The points can be moved about freely, or confined to a vertical line. Clicking on a point reveals a component of the final polynomial associated with the point. The applet should run independently of Cinderella as long as the two javascript files are present in the same folder. Applet |
|
Graphs of chordal rise for FE and FW chords.
(which is which?) |
Chordal Rise
|
Chordal Gaps
|
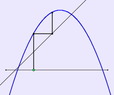
Consider the difference between the value of a function at the midpoint of an interval, and the point on the chord t it's midpoint. How fast does this gap go to zero in terms of powers of the interval width?
What about at a mu-point of the interval? Or the difference between the mu and (1-mu) gaps? |
Other Function-Graphing Explorations
|
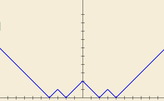
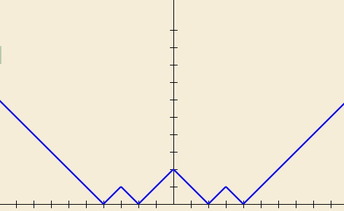
ZigZagsWhat would the graph of f(x) = |||x| – 2| – 1| look like?
What if the sequence [2, 1] was repeated over and over? What is the algebraic formula for the ZigZag shown? Characterise ZigZags that can be formed in this way. The Applet supports exploration of ZigZags. What about allowing multiplicative coefficients? What would be the same and what different for |||x – 2| – 1| and |||x| – 2| – 1|? |
|
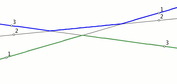
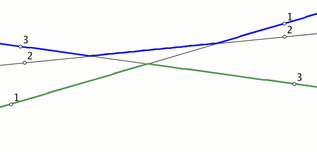
Max-Min LinesHere you see three lines, each of which gives either the maximum value, or the minimum value on some interval. Can you do better?
What about n lines? The Applet supports up to six lines, and these can be adjusted geometrically (moving the white points) or algebraically (adjusting the coefficients of equations). |
|
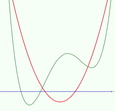
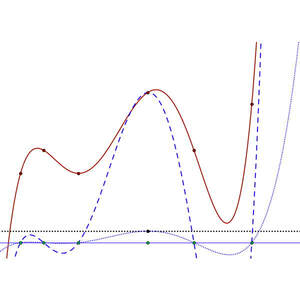
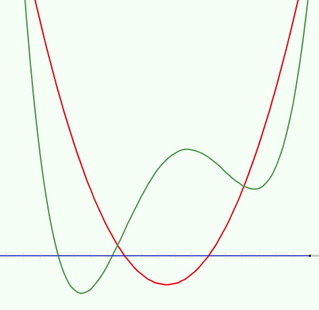
Rational PolynomialsHere you see a quartic (green, numerator) and a quadratic (red, denominator). How much about the graph of their quotient can you deduce from their graphs?
The Applet supports polynomials up to degree 7. The notes provide information about the applet, and suggests ways of working with it. See also Mason (2015). Mason, J. (2015). Developing & Using an Applet to Enrich Students’ Concept Image of Rational Polynomials. Teaching Mathematics and its Applications. doi: 10.1093/teamat/hrv004 |
CobWebs
|
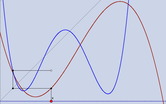
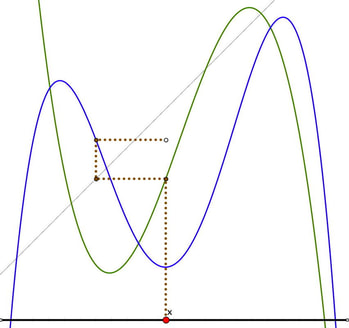
The animation introduces a construction. What is happening? Starting from X, where does the white point end up and what is its locus?
The applet cobwebs.zip supports work on this question, and displays the locus. There are notes to help manage the applet. The applet also enables investigation of both horizontal and vertical alignments. NOTE: keeping the html file with the two Cindy-js files should mean the applet is stand-alone. |
|
|
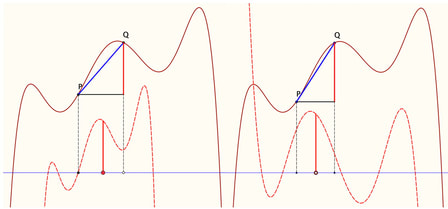
Iterated CobwebsThe animation shows a phenomenon that needs explaining.
The applet permits other polynomial and control over the number of iterations, Some of the parameters are chosen by pressing and holding a button while typing in a number. |
|
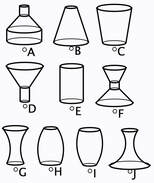
Flask Graphs
The applet offers choices of graphs of radius, surface area and volume against height, volume and surface area against radius, and volume against surface area. Twelve graphs are offered so there is a challenge to design a flask matching the extra graphs. Applet: Flask Graphs |

|